Harnessing Tech Stock's Potential: A Smart Portfolio Strategy with the AI Insights Platform
The tech sector's surge has pushed the S&P 500 and Dow Jones to record highs, spotlighting the influence of the "Magnificent Seven"—tech behemoths like Microsoft, Apple, and Amazon—that drive 28.8% of the index. Expanding focus to the top 20 tech firms, we dub them the "Fabulous 20," their share jumps to 35.8% of the S&P 500, illustrating their significant market sway. Investing in these leading tech companies offers high returns but comes with notable risks. The AI Insights Platform provides a strategic avenue for professional investors to explore these opportunities, tailoring investments in the "Fabulous 20" to align with individual risk preferences and goals through AI-optimized portfolios.
The tech industry is propelling the stock market to unprecedented peaks, as evidenced by the S&P 500 and Dow Jones Industrial Average, both achieving all-time highs on March 1st. Attention is centered on the "Magnificent Seven," a nickname given by Bank of America analyst Michael Hartnett to the seven biggest tech-centric firms in the S&P 500: Microsoft, Apple, Nvidia, Amazon, Alphabet, Meta Platforms, and Tesla. Together, these giants constitute 28.8% of the index's value.
The "Magnificent Seven" hold a dominant position in the U.S. stock market. However, when considering the top 20 technology-oriented companies, their collective contribution rises to 35.8% of the S&P 500. This group encompasses the "Magnificent Seven" along with Broadcom, Adobe, Salesforce, Advanced Micro Devices, Netflix, Cisco, Intel, Oracle, Intuit, Qualcomm, ServiceNow, IBM, and Texas Instruments.
Investing in the "Fabulous 20" group of stocks can offer significant returns, but it also comes with considerable risks. The AI Insights Platform enables professional investors to engage with these high-risk stocks in a way that aligns with their individual investment objectives and tolerance for risk. By leveraging AI optimization, investors can experiment with a portfolio that incorporates the "Fabulous 20," tailored specifically to their preferences on the AI Insights Platform.
A Tailored AI Portfolio
What sets the aisot AI Insights Platform apart is its ability to tailor portfolios to individual investment goals and risk appetites. Whether you're a conservative investor focusing on blue-chip AI integrators or seeking the high-reward potential of tech startups making their mark, aisot's platform can guide your strategy. It dynamically adjusts your portfolio based on the latest market trends and breakthroughs in AI, ensuring your investments remain at the innovation frontier. To showcase the AI Insights Platform’s capabilities, we’re working with a portfolio of the Fabulous 20. Unlike most of the Fabulous 20 stocks, we’re aiming for a portfolio with a volatility comparable to the one of the S&P 500, lower drawdowns but trying to substantially increase Sharpe and Sortino ratio.
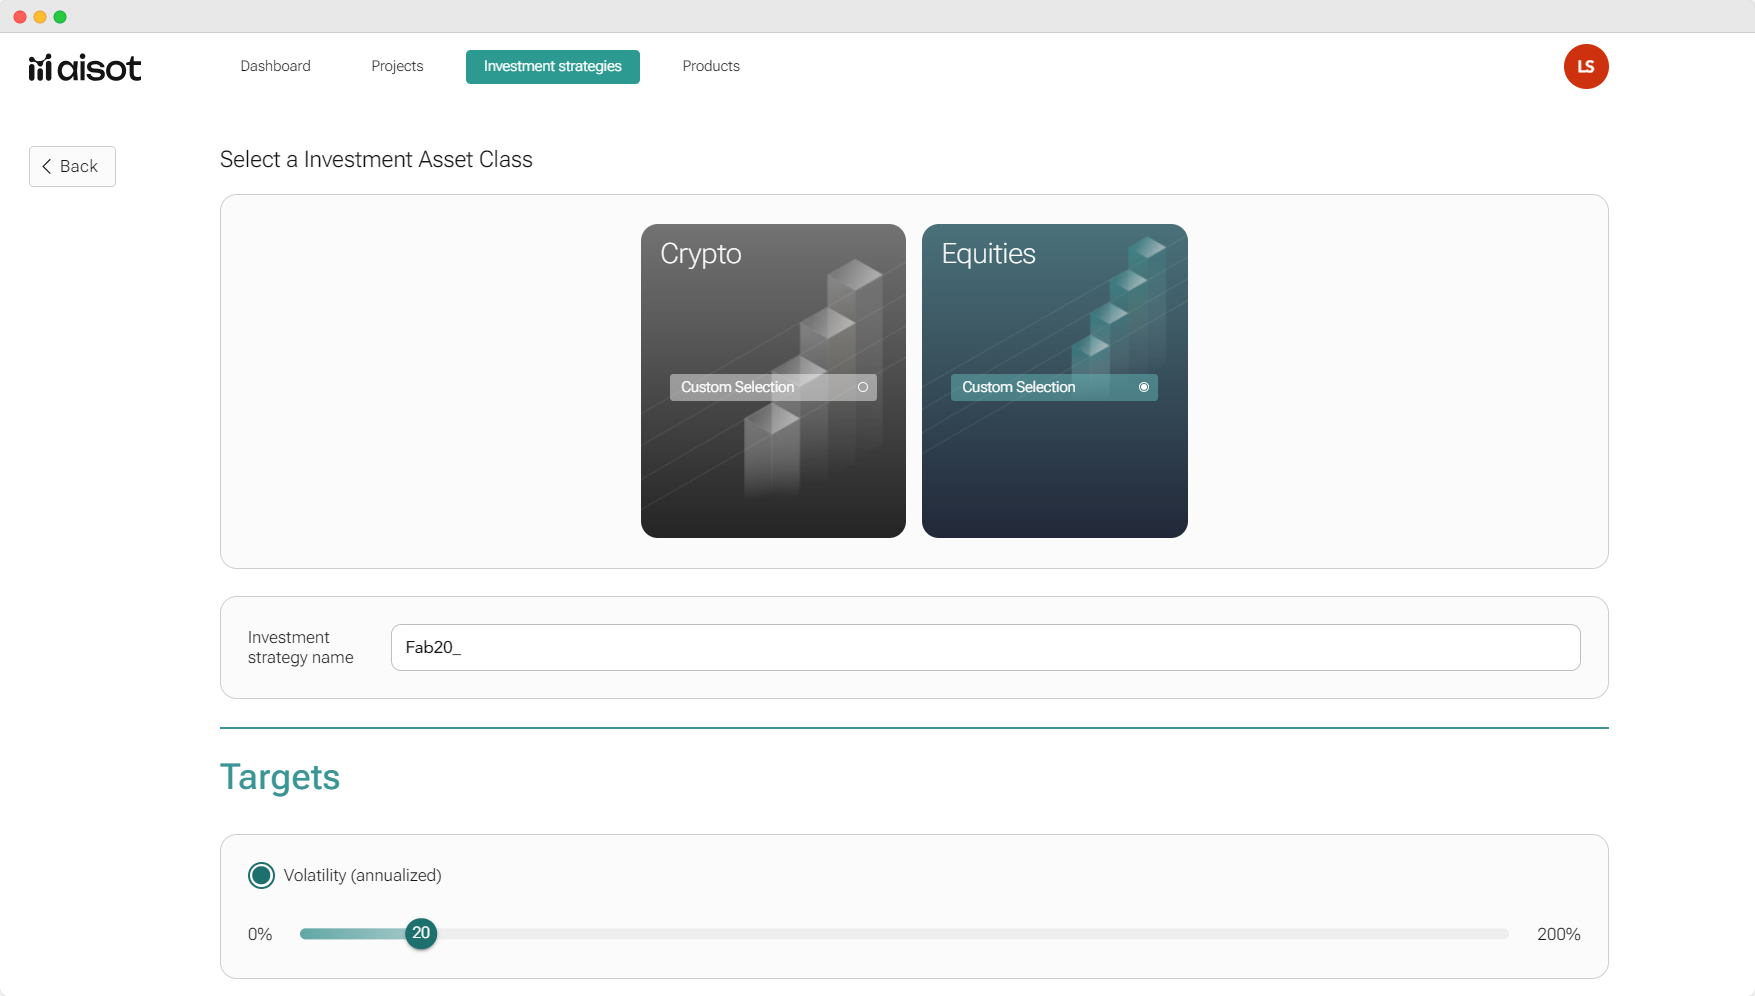
We set the annualized volatility target at max 20%:
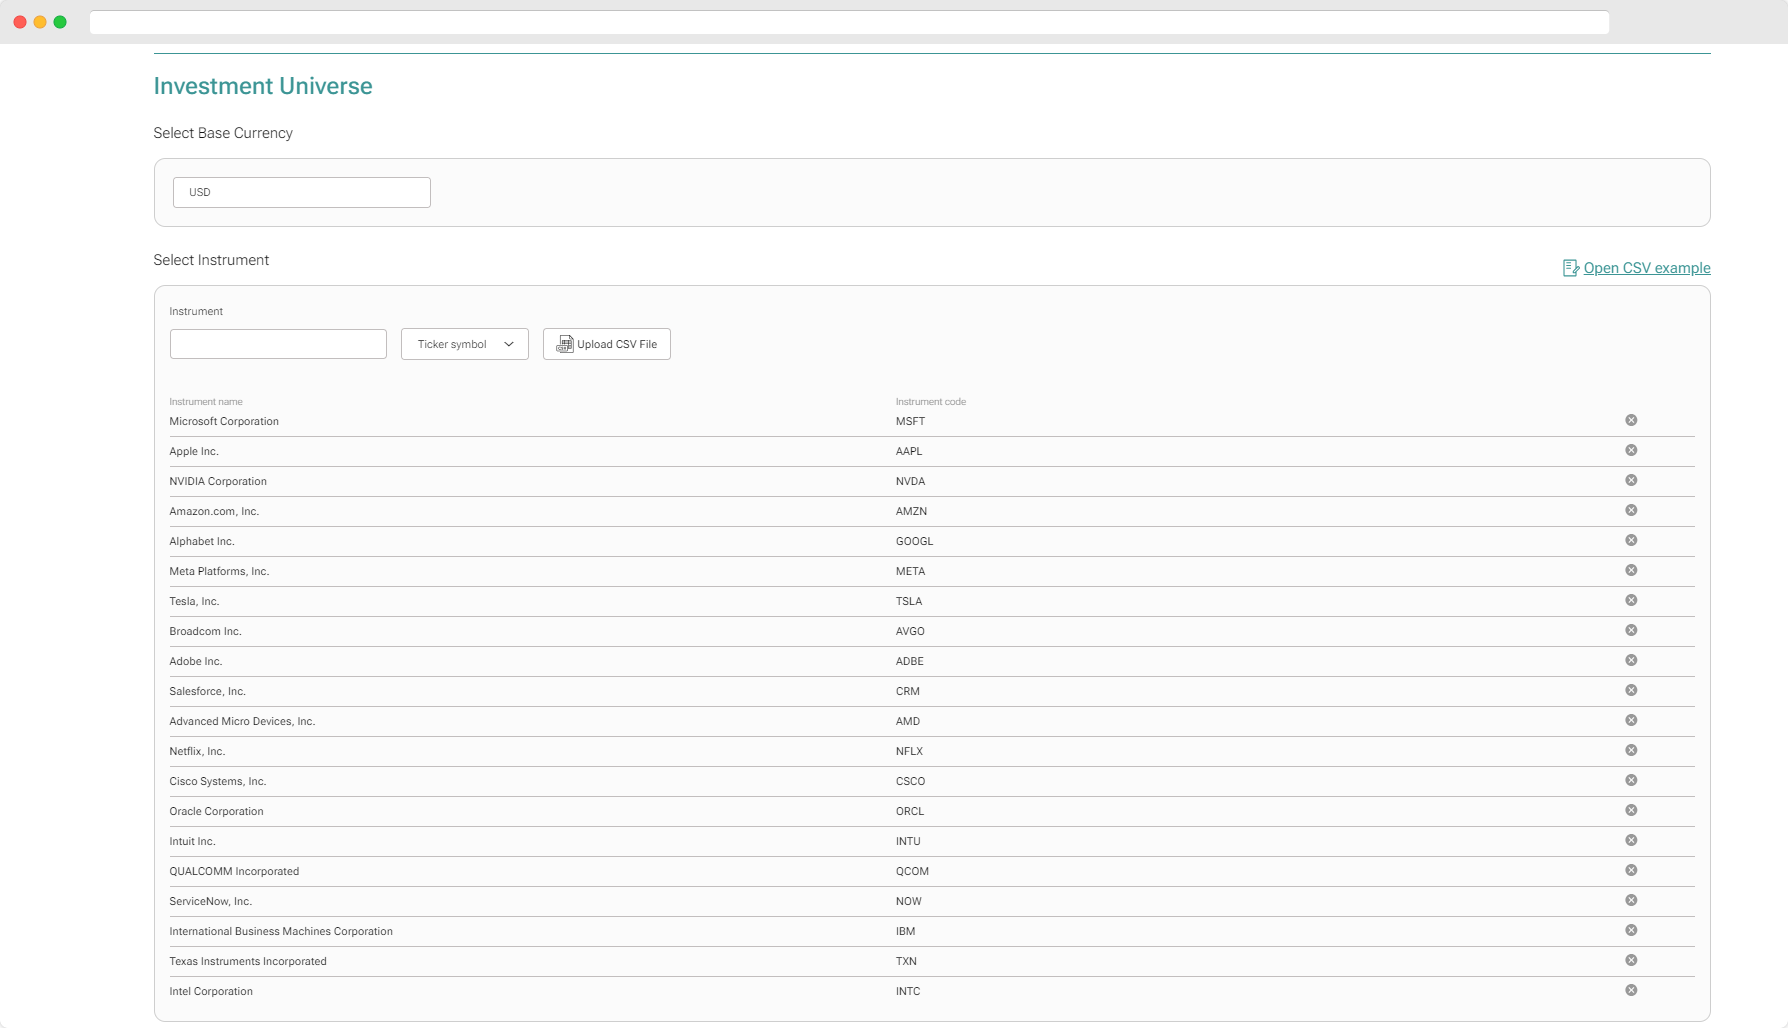
Select the investment universe and the 20 stocks:
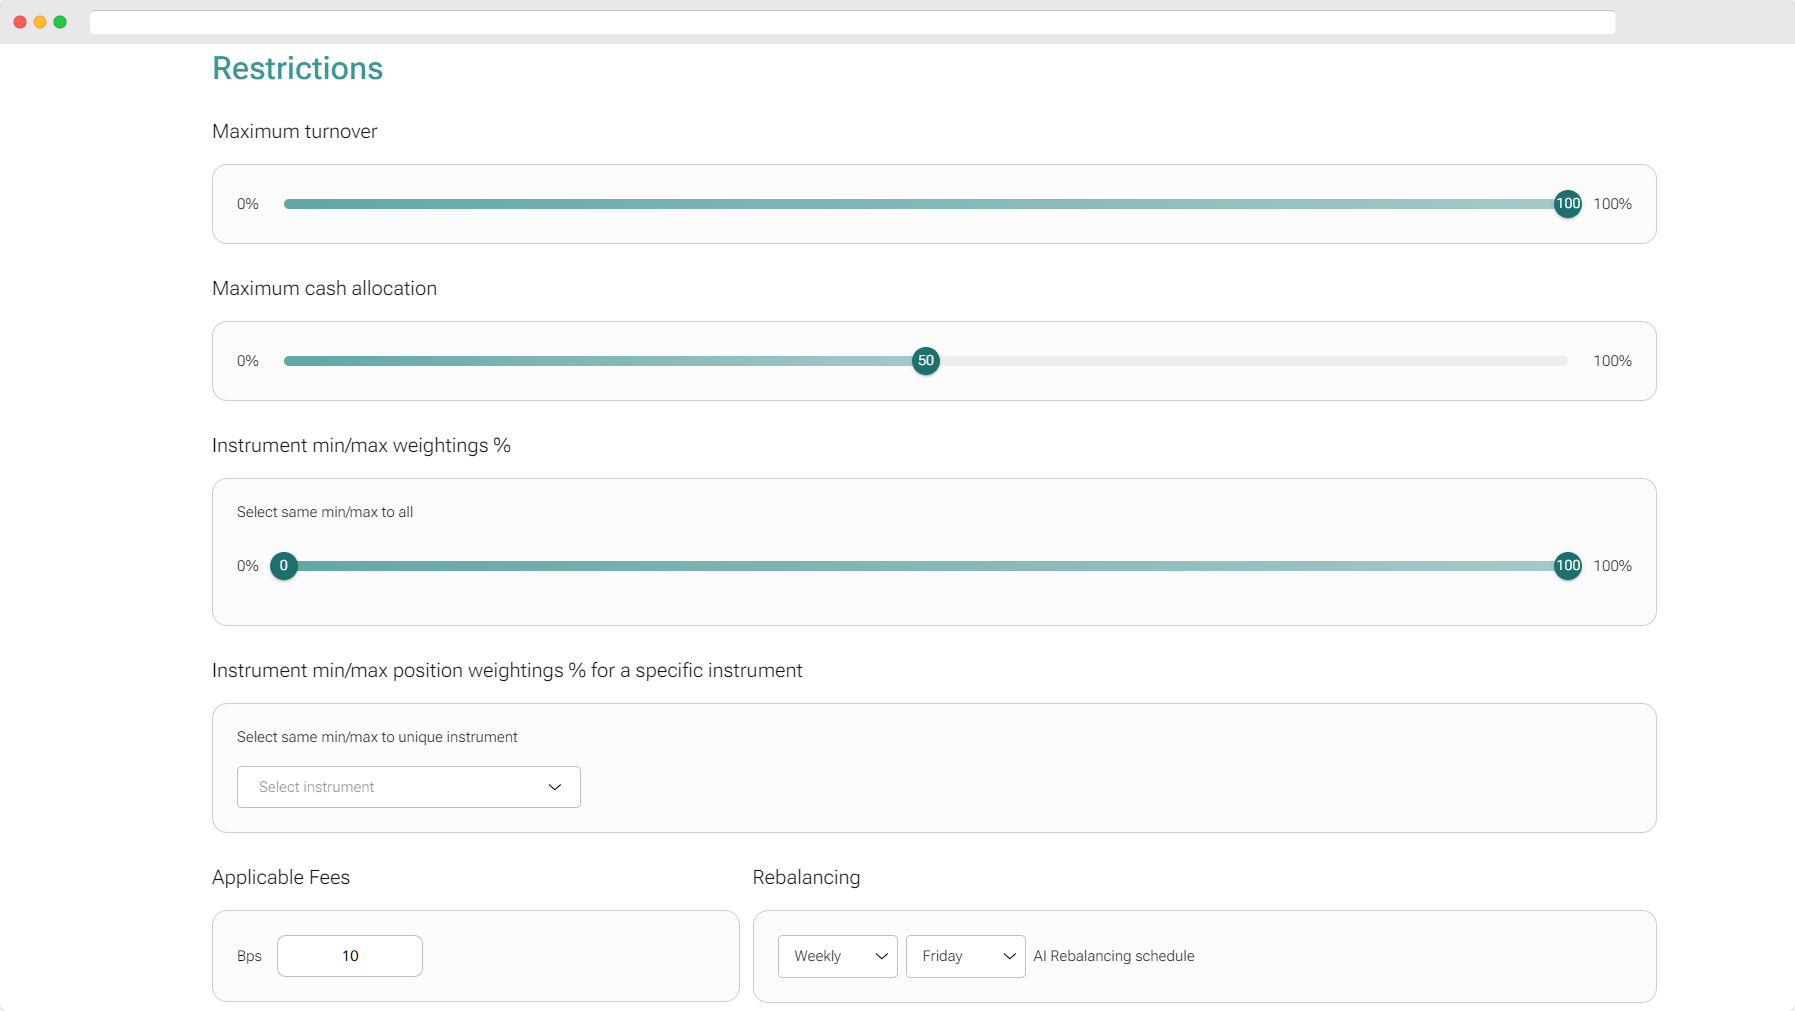
Add restrictions: maximum turnover at 100%, a relatively high maximum cash allocation with 50% to give the portfolio the ability to move positions to cash in down-markets, and 0-100% min/max weightings to get the full performance potential of the AI Insights Platform. The fees we allocate at 10 bps. Then we simply generate the portfolio.
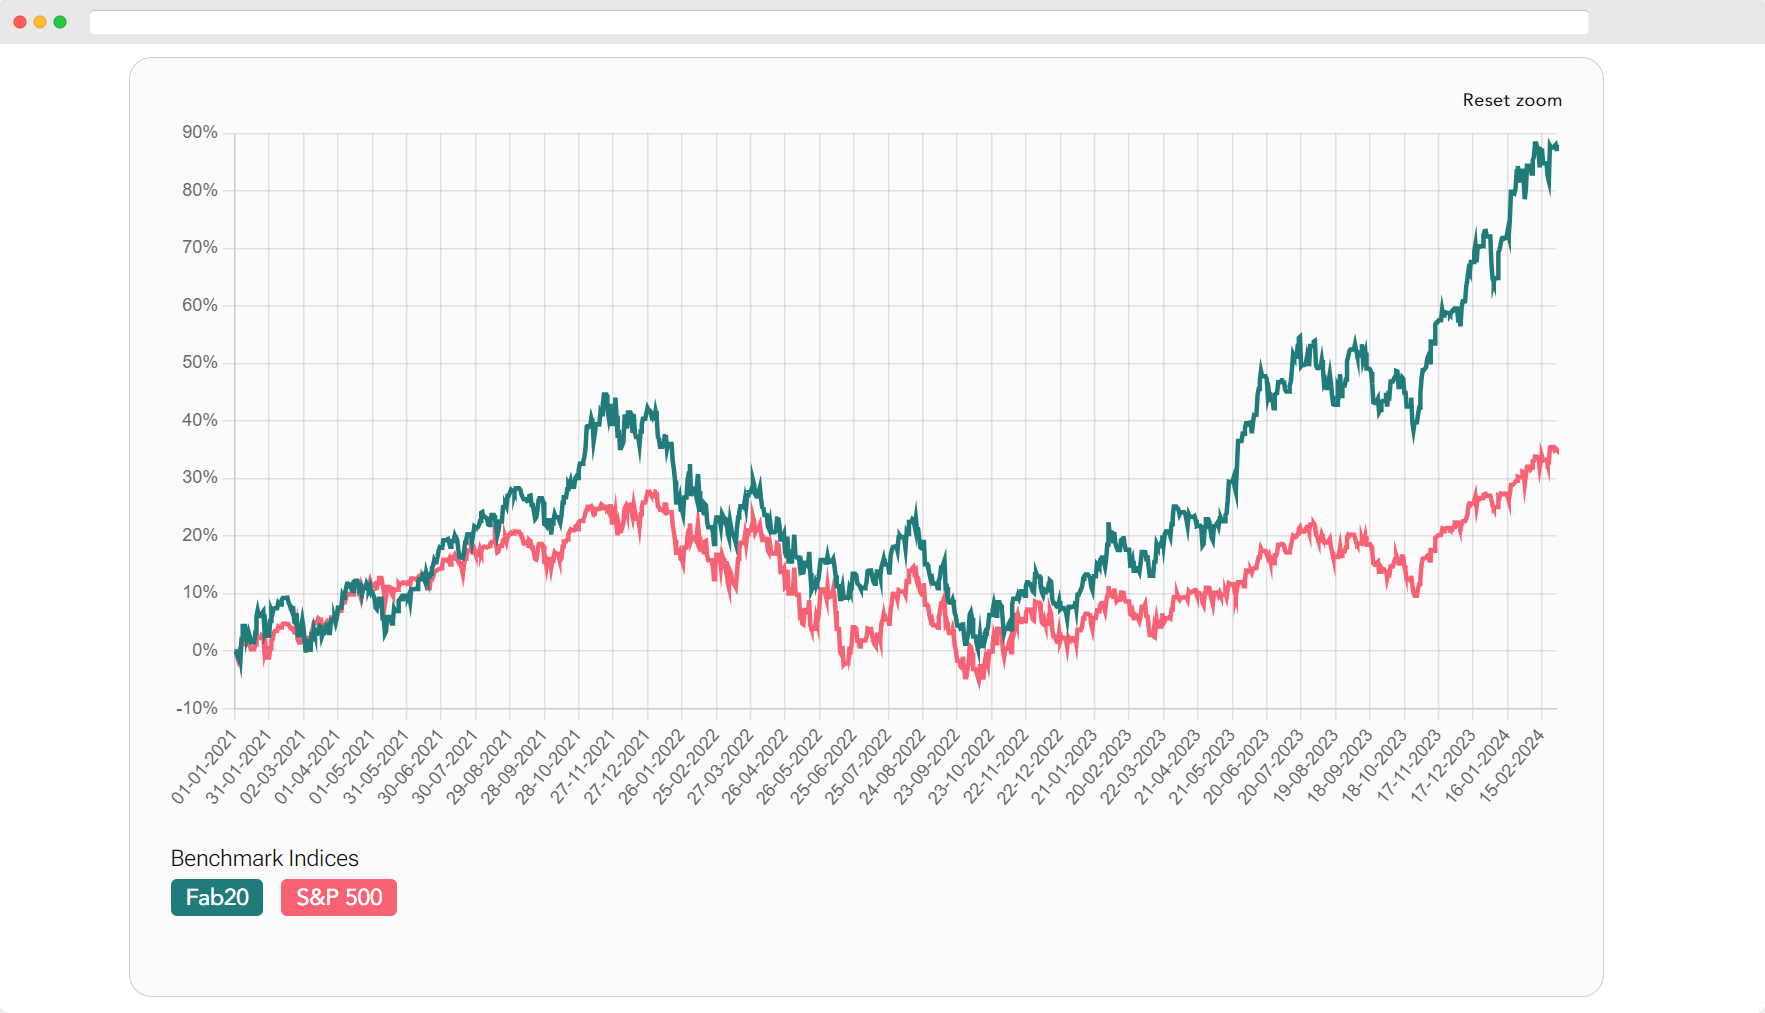
Here's the result: The Sharpe and Sortino ratios of the AI supported portfolio have increased substantially, achieving our goal of keeping drawdown and volatility low, comparable to the S&P 500, while securing a cumulative return that's roughly three times higher than that of the S&P 500 over the same period.
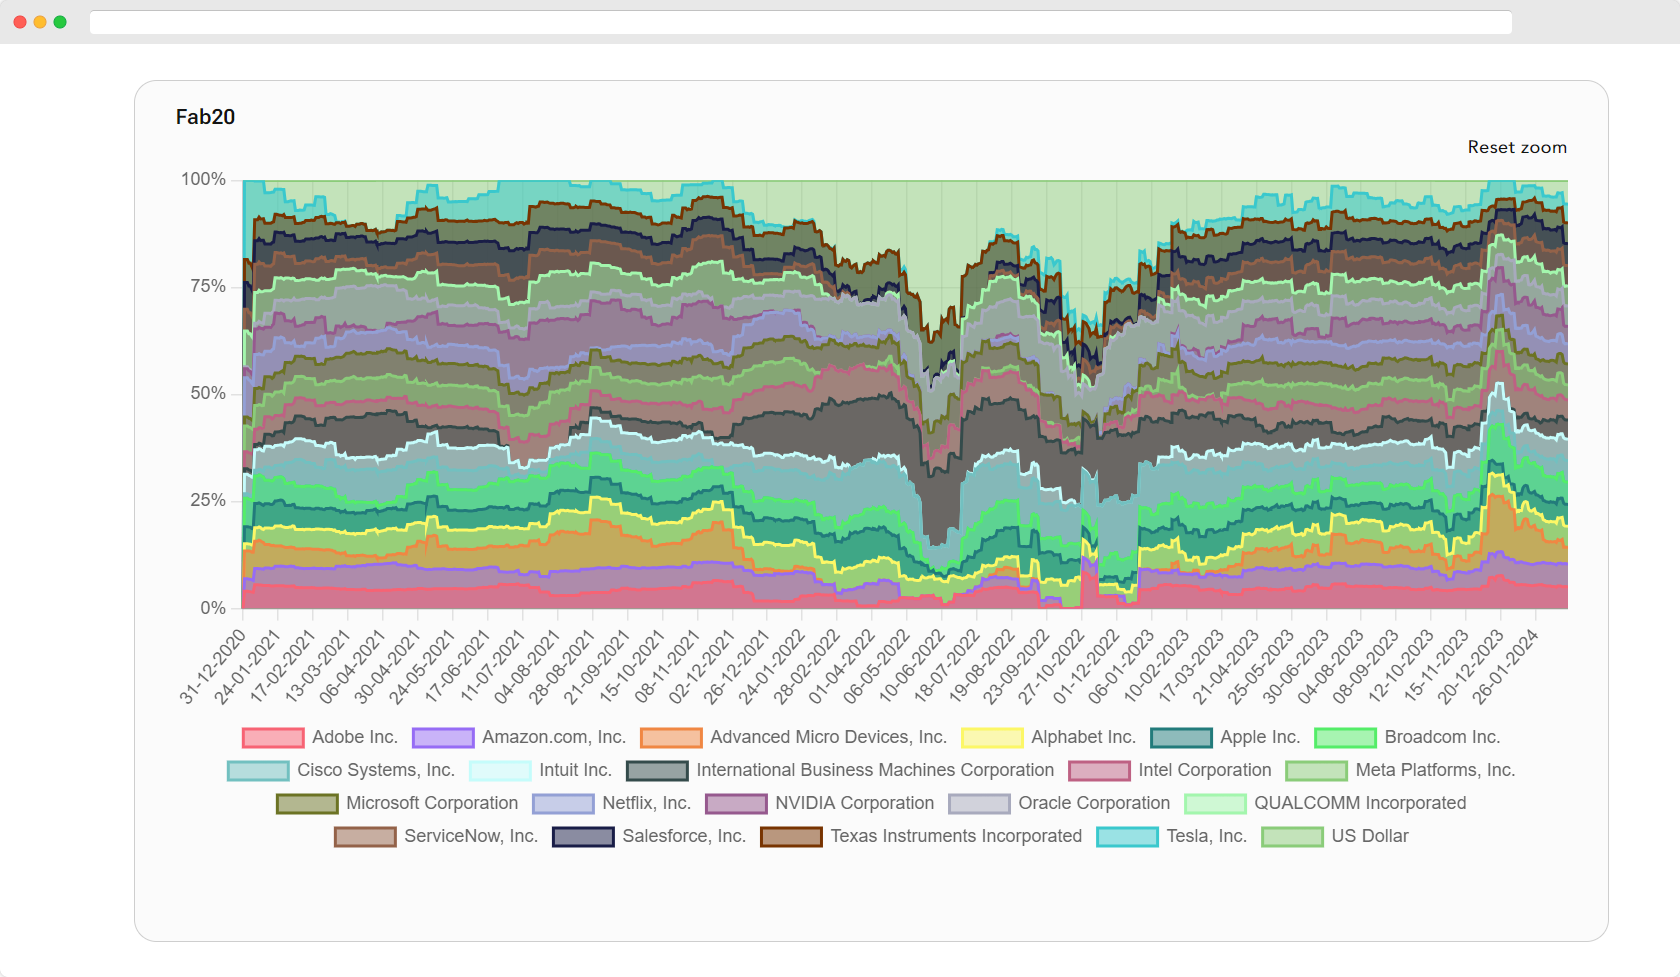
Here, we observe the historical allocation strategy of the portfolio. It is evident that the platform strategically utilized cash (light green, on top) during market downturns to maintain control over volatility and drawdowns.
| Fab20 | S&P 500 | |
| Sharpe | 0.9311 | 0.6336 |
| Sortino | 1.3598 | 0.9057 |
| Max Drawdown | -0.3547 | -0.2542 |
| Annualized Volatility | 0.2320 | 0.1700 |
| Annualized Return | 0.2082 | 0.0977 |
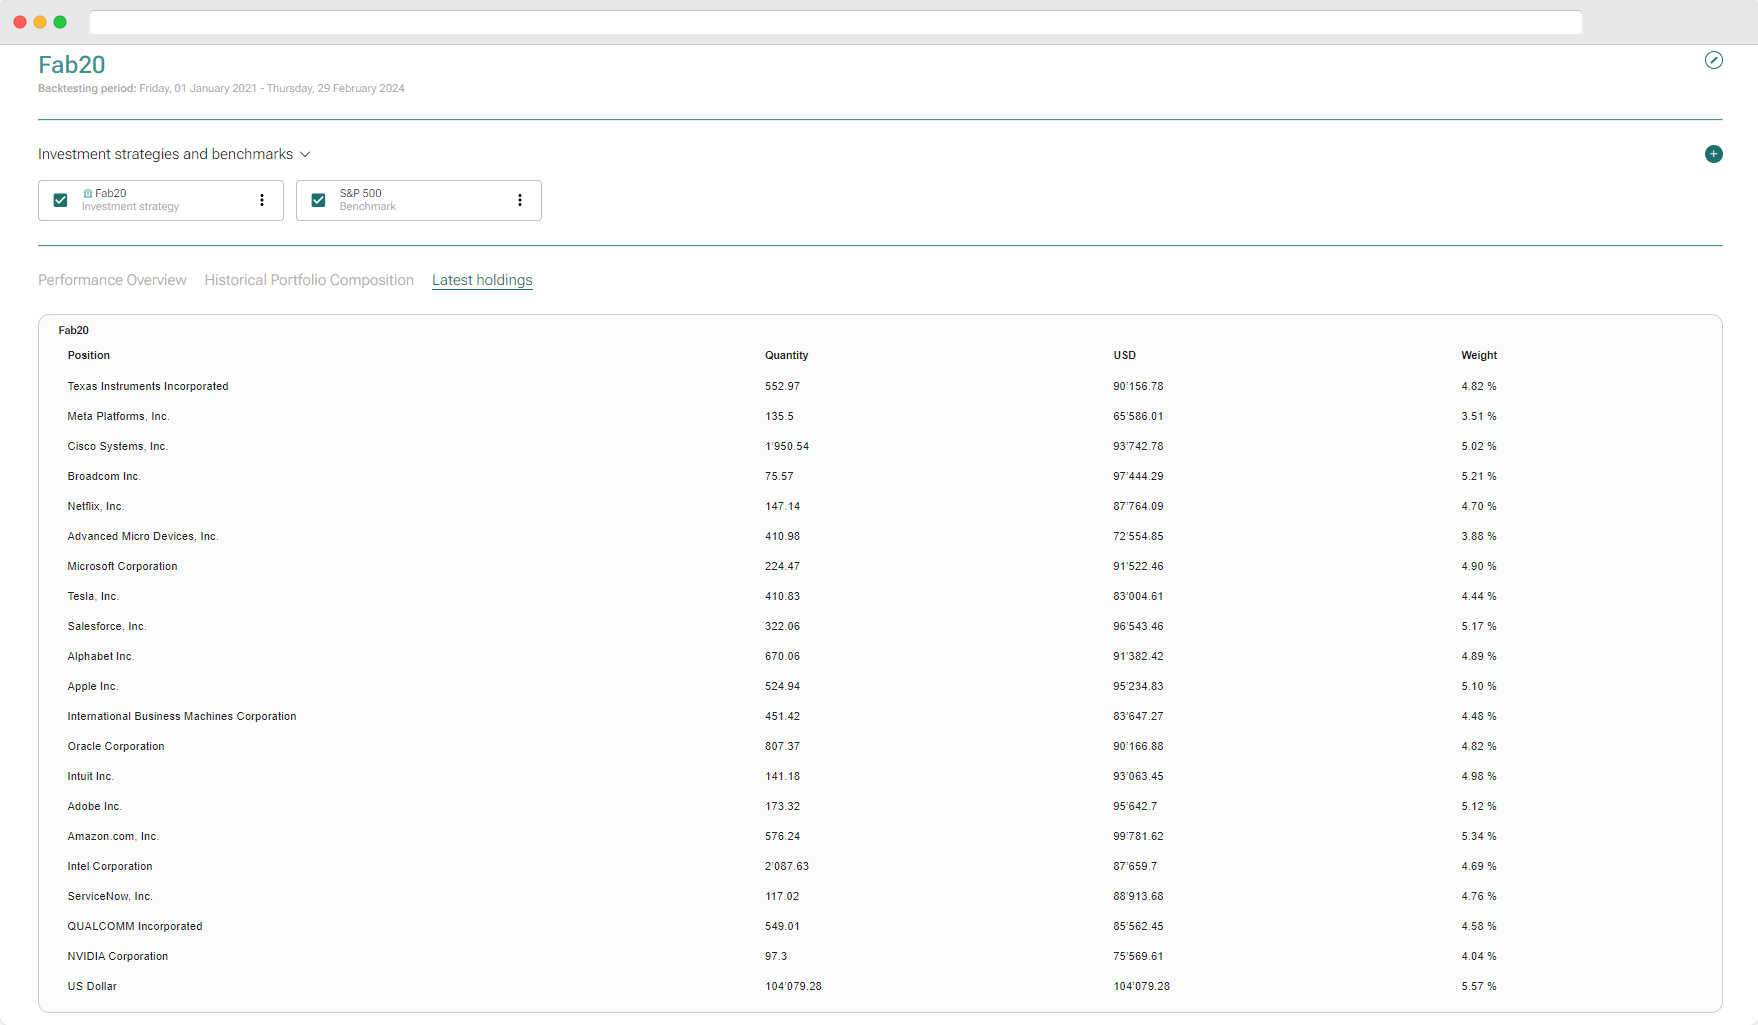
Finally, the AI Insights Platform produces up-to-date portfolio holdings, offering potentially actionable insights for the discerning professional investor.
Comparison to non-optimized portfolio
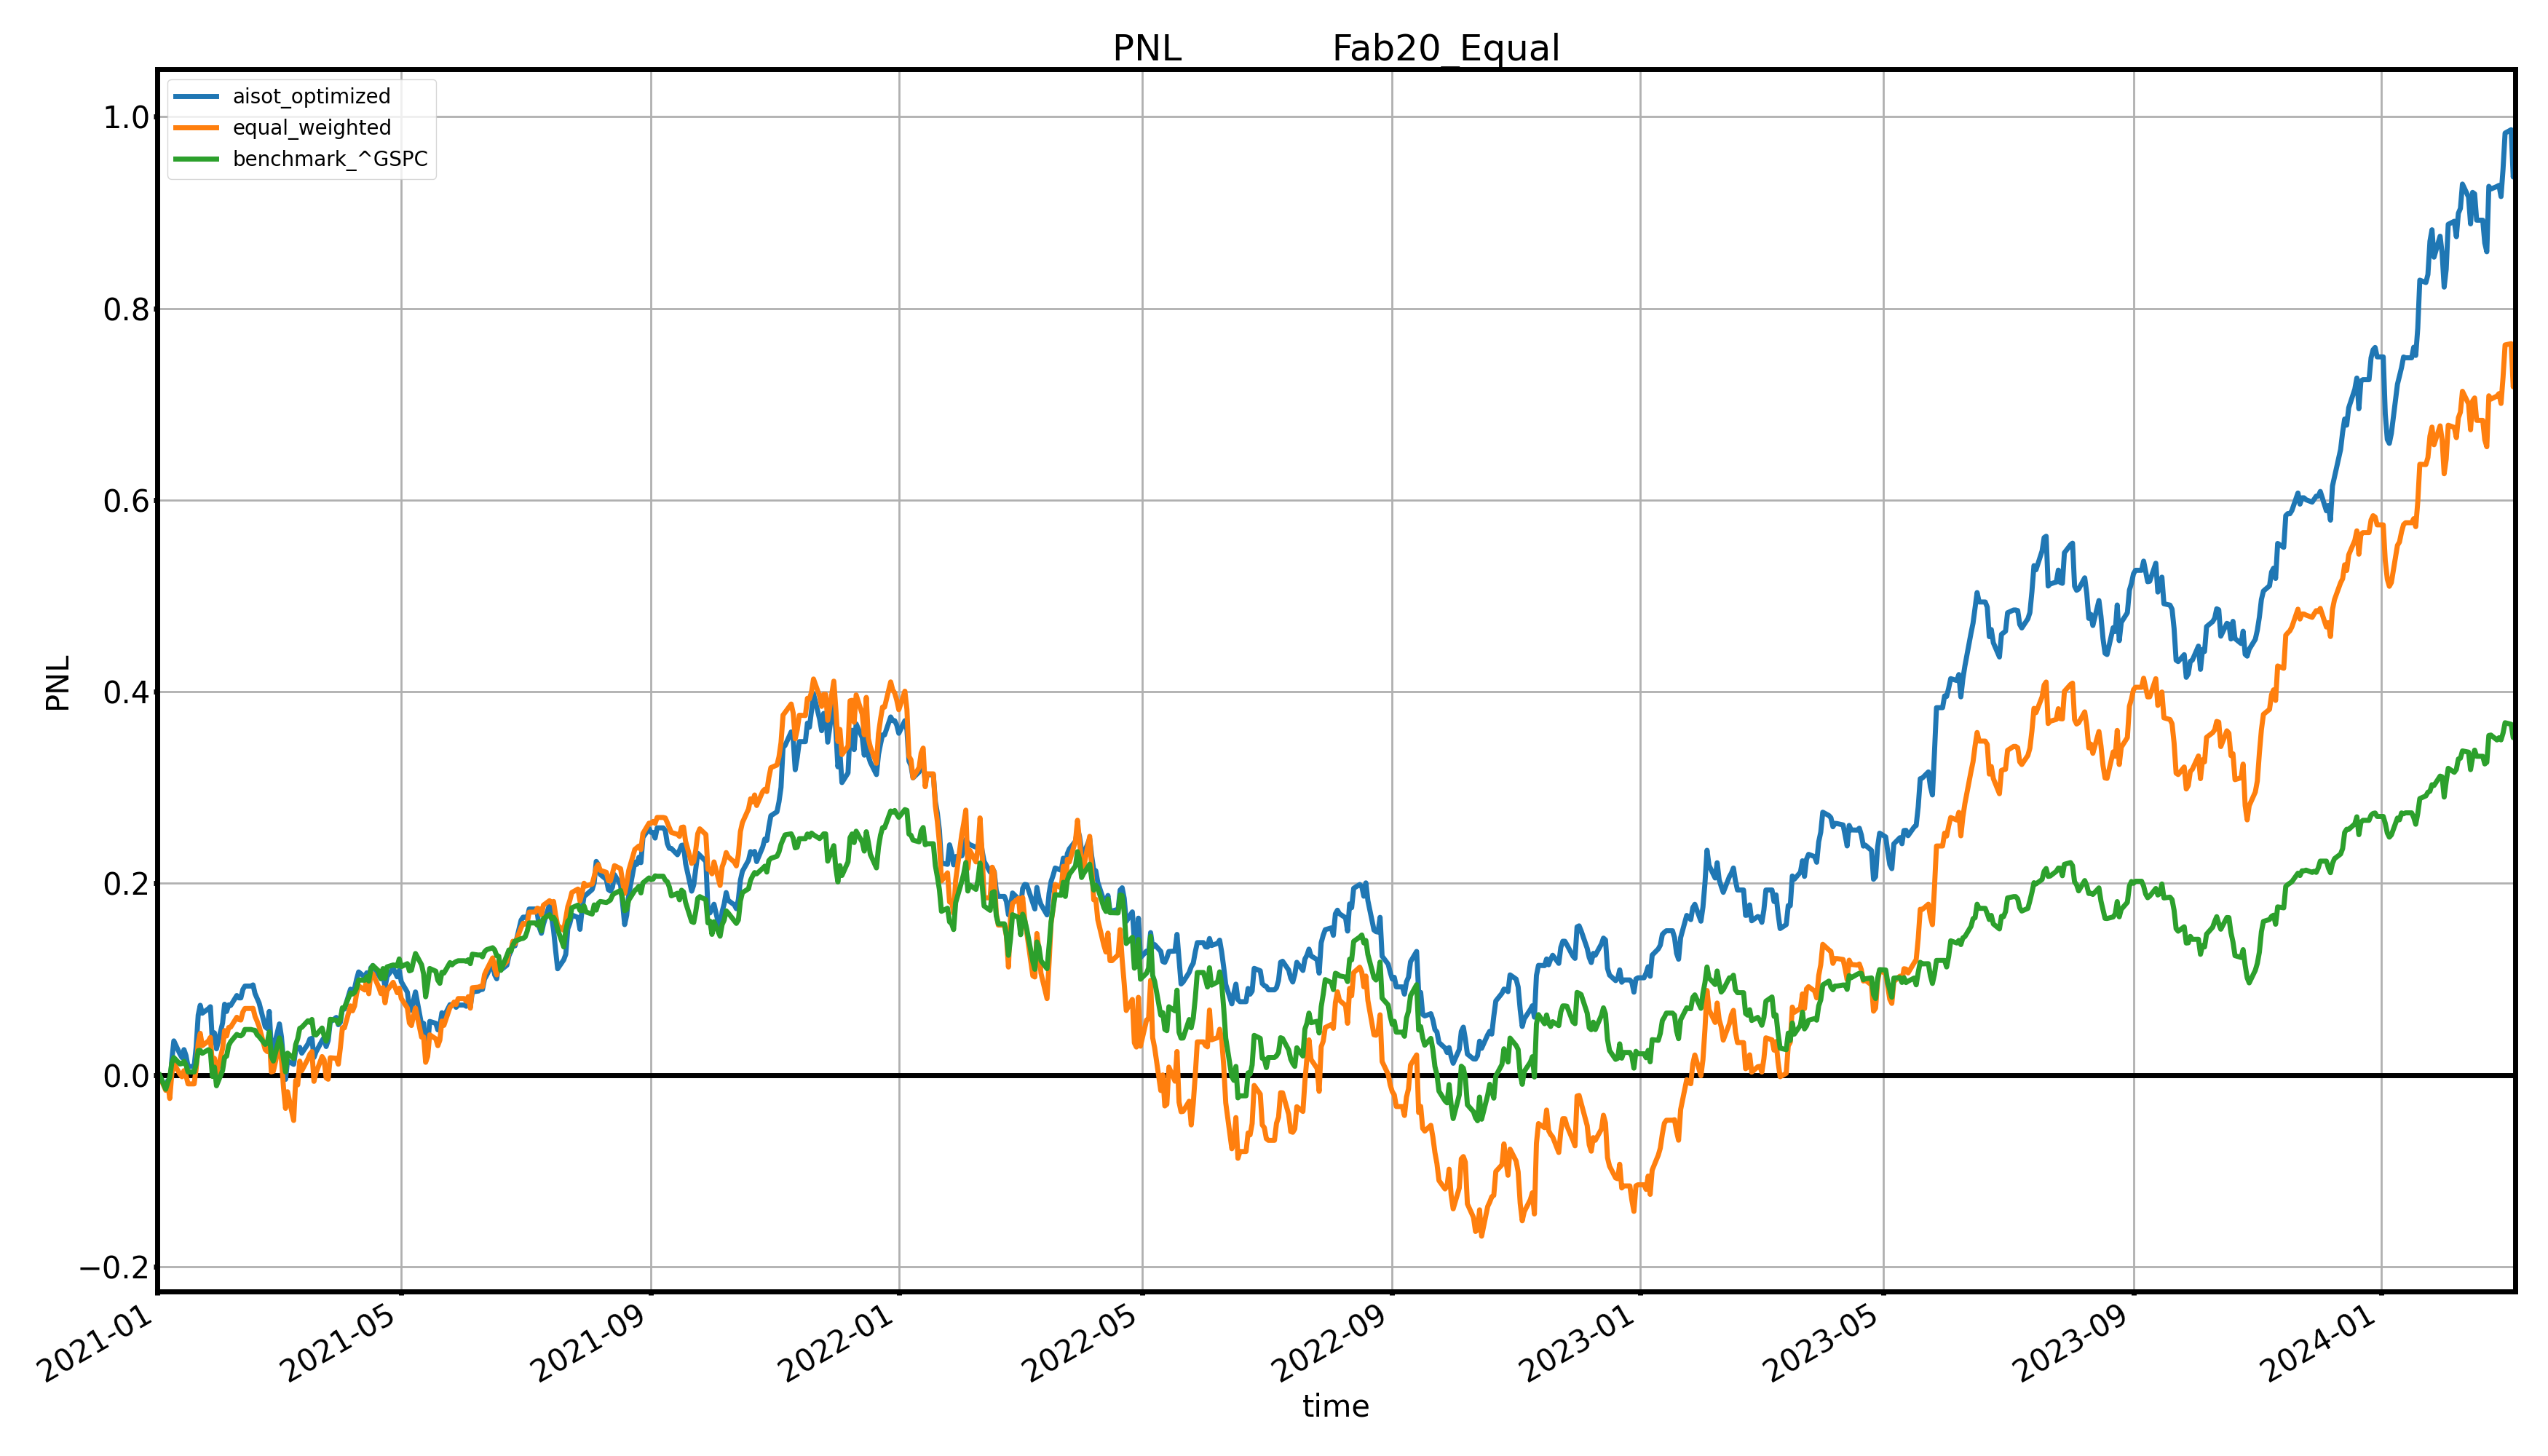
Given the significant influence of the Fabulous 20 on the overall performance of the S&P 500, it could be tempting to speculate that a non-optimized, equally-weighted portfolio of these stocks might mirror the outcomes of its optimized counterpart. However, despite the equally-weighted and non-optimized Fabulous 20 portfolio outperforming the S&P 500, its key performance metrics fall short when compared to those of the optimized portfolio.
| Fab20 | Fab20 Equalized | S&P 500 | |
| Sharpe | 0.9311 | 0.7875 | 0.6336 |
| Sortino | 1.3598 | 1.1446 | 0.9057 |
| Max Drawdown | -0.3547 | -0.4105 | -0.2542 |
| Annualized Volatility | 0.2320 | 0.2627 | 0.1700 |
| Annualized Return | 0.2082 | 0.1881 | 0.0977 |
Regressing the daily returns of the optimized portfolio against those of the equally-weighted portfolio reveals that, on average, it outperforms the equally-weighted portfolio by about 10% annually, while maintaining a correlation of about 0.85. This underscores the effectiveness of aisot's forecasting and portfolio construction methodologies.
Conclusion
As tech continues to redefine industries and create new markets, the opportunity for investors is clear. However, harnessing this potential requires sophisticated, AI-powered tools like the aisot AI Insights Platform. By providing deep insights, tailored strategies, and dynamic optimization, aisot empowers investors to build a portfolio that's not just ready for the future but designed to thrive in it.

